DIGITAL MAPPING PORTFOLIO
RAY HASENYAGER
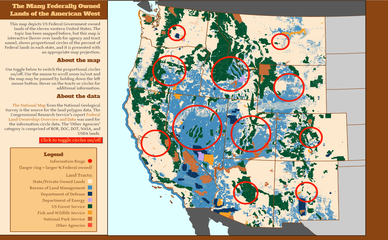
This map was built using HTML, CSS, JavaScript, and D3.js. It was especially challenging due to using a large data set while also ensuring the the map remained responsive.
It shows the US federal government owned lands across the 11 western states. The purpose of the map is allow the user to discover these tracts, the percentage by state of Federal owned land, and the agency responsible for their management. The proportional circles can be displayed or hidden and by hoverign on the circle view state level information. By hovering over the many tracts, the user will see the agency, tract name, and tract type.

This map was built using HTML, CSS, JavaScript, and Leaflet on an OpenStreetMap base map through CartoDB.
It shows fossil fuel plants across the United States. By clicking on the map the user will see all indicated plants within a 500 km radius to the click point and the plant pop ups will be dsplayed when a user clicks on the plant circle. Circles indicate kilowatt output by the circle's size. Users may turn on/off the layers as indicated.
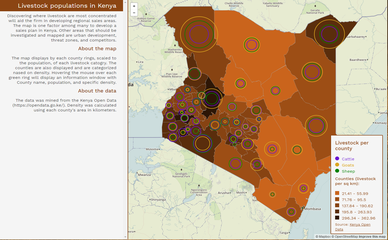
This map was built using HTML, CSS, and Mabbox.js on a Mapbox base map.
It shows livestock populations in Kenya. By hovering over the rings the user is provided the density of livestock per county and population information on cattle, sheep, and goats.
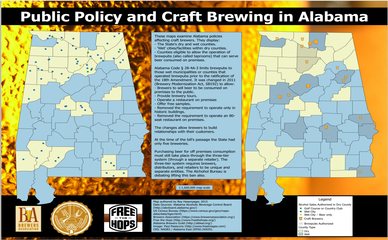
This map was built with QGIS by importing county polygons and geocoding brewery addresses.
The maps show Alabama's wet and dry counties/cities, craft breweries, and counties where brewpubs/taprooms (auhtorized to sell alcohol to be consumed on premises) are authorized.
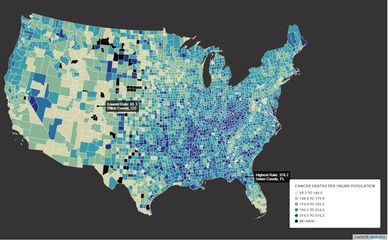
The map was built with CartoDB and uses a custom CRS. The map uses imported county polygons and cancer dath information. The color scheme was developed using ColorBrewer 2.0.
The data describe cancer rates for all cancer sites by mortality, for all races, sexes, and ages, averaged over years 2008 through 2012.
View Ray's GitHub Codebase. Which includes various web map coding projects.
About Ray:
Ray lives near Huntsville, Alabama and has experience supporting digital mapping projects for the Department of Defense to include the 2014 West Africa Ebola Outbreak, kinetic and relief operations in Libya, and creating a Logistics Common Operating Picture (LOGCOP) of logistics capabilites across the European and African continents for the US Africa Command. He earned a Graduate Certificate in Digital Mapping from the University of Kentucky's New Maps Plus program. He was resently accepted into the UNIGIS Amsterdam Master of Science Program in Geographical Information Sciences at Vrije Universiteit Amsterdam.